Freelance Operations Dashboard
Introduction
Running a solo consulting business involves coordinating multiple operational areas simultaneously. Freelancers must manage client acquisition, project delivery, workload capacity, and financial performance at the same time.
Without clear visibility into these areas, operational decisions often rely on intuition rather than structured data.
Freelancers may ask questions such as:
- How full is my pipeline?
- How much delivery capacity remains available?
- Which clients are most profitable?
- Are current projects progressing as expected?
Without consolidated visibility, answering these questions requires switching between multiple tools, spreadsheets, and documents.
Within the Processome operating model, operational visibility belongs to the → Delivery & Operations System, the framework responsible for maintaining execution stability and coordination across business activities.
A freelance operations dashboard consolidates key operational metrics into a single system view.
Instead of analyzing each system independently, freelancers gain an integrated overview of their consulting business.
Operational visibility supports better decision-making.
The Core Problem
Many freelancers track information across several disconnected tools.
Examples include:
- CRM systems for pipeline management
- time tracking tools for delivery work
- accounting software for financial performance
- task management systems for project progress
While each tool provides useful information, they rarely present a unified operational view.
This fragmentation introduces several operational challenges.
Limited Business Visibility
Freelancers may not have a clear overview of their current business position.
Slow Decision-Making
Important decisions require gathering information from multiple sources.
Hidden Operational Risks
Capacity overload or pipeline gaps may go unnoticed until they become urgent problems.
Inefficient Monitoring
Freelancers may spend excessive time reviewing data across different systems.
These issues arise not from missing data, but from missing operational visibility.
Concept Explanation
A freelance operations dashboard is a centralized overview of the key metrics that govern the consulting business.
Rather than tracking individual activities separately, the dashboard aggregates critical indicators from multiple operational systems.
Typical dashboard categories include:
- pipeline visibility
- capacity utilization
- project delivery status
- financial performance
By combining these indicators, freelancers gain a comprehensive view of their business operations.
The dashboard does not replace individual tools.
Instead, it consolidates insights from multiple systems.
These systems correspond to the four pillars of the Processome architecture:
→ Client Pipeline System
→ Capacity Planning System
→ Profit Tracking System
→ Delivery & Operations System
The dashboard therefore acts as an operational control center.
Freelance Operations Dashboard Framework
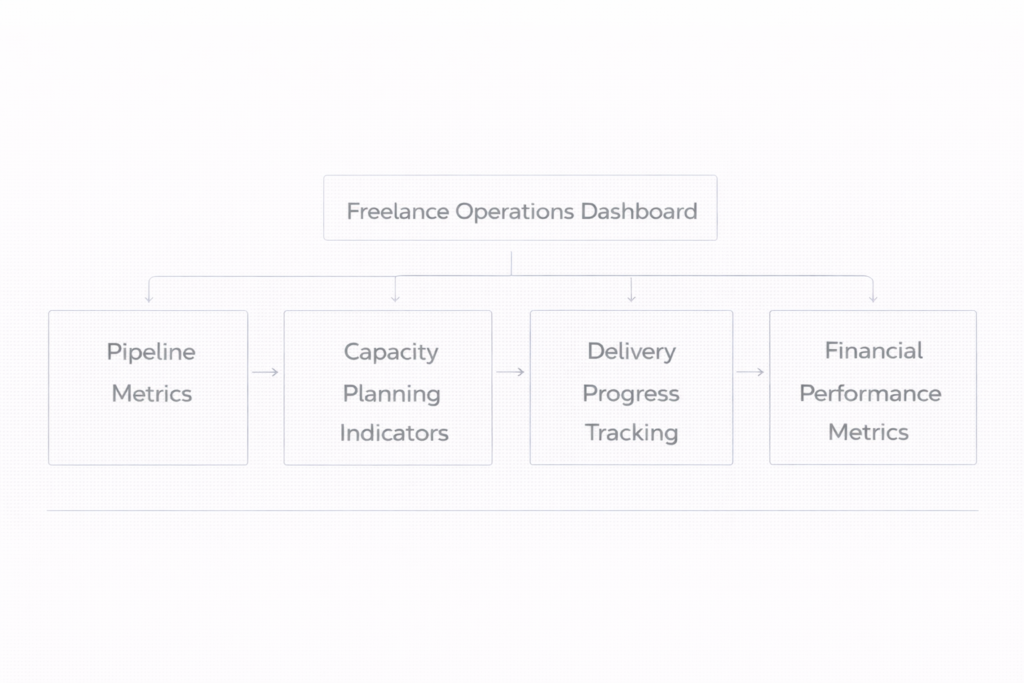
A structured freelance operations dashboard typically includes four operational panels.
1. Pipeline Visibility Panel
This panel provides insight into upcoming client opportunities.
Typical indicators include:
- number of active opportunities
- pipeline value
- weighted revenue forecasts
- deal stages
Pipeline visibility helps freelancers anticipate future demand.
This connects to:
→ Pipeline Health Metrics
→ Weighted Revenue Forecasting for Freelancers
2. Capacity Planning Panel
This section monitors workload capacity.
Indicators may include:
- current utilization rate
- scheduled delivery hours
- remaining available capacity
- upcoming project start dates
Capacity metrics ensure that workload remains aligned with delivery limits.
This connects to:
→ Utilization Rate for Solo Consultants
→ Capacity Forecasting from Pipeline Data
3. Delivery Status Panel
Delivery metrics track the progress of active consulting engagements.
Typical indicators include:
- project milestones
- deliverable deadlines
- task progress
- client feedback cycles
Delivery status visibility ensures that projects remain on track.
This connects to:
4. Financial Performance Panel
The financial section monitors profitability and revenue patterns.
Indicators may include:
- revenue by client
- contribution margin
- effective hourly yield
- revenue concentration
Financial metrics provide insight into the economic performance of consulting work.
This connects to:
→ Client Profitability Analysis for Freelancers
→ Contribution Margin in Freelance Businesses
Operational Impact
Implementing an operations dashboard improves several aspects of freelance consulting management.
Faster Decision-Making
Freelancers can quickly evaluate the state of their business.
Improved Operational Awareness
Key metrics become visible in a single location.
Early Risk Detection
Pipeline gaps or workload overload can be identified earlier.
Better Strategic Planning
Operational visibility supports informed business decisions.
Dashboards therefore transform fragmented data into actionable insight.
System-Level Impact Across Processome
An operations dashboard integrates insights across the entire Processome architecture.
Client Pipeline System → pipeline visibility informs revenue expectations
Capacity Planning System → workload capacity metrics reveal delivery feasibility
Profit Tracking System → financial indicators reveal margin quality
Delivery & Operations System → project progress tracking supports execution stability
The dashboard therefore acts as the operational interface connecting all systems.
Common Failure Patterns
Freelancers often struggle with operational visibility because dashboards are poorly designed or absent.
Several patterns frequently appear.
No Central Overview
Metrics remain scattered across multiple tools.
Excessive Metrics
Dashboards track too many indicators, reducing clarity.
Infrequent Monitoring
Freelancers review metrics only when problems appear.
Data Without Context
Metrics exist but are not connected to operational decisions.
These issues reduce the usefulness of operational dashboards.
Strategic Outcome
When a structured operations dashboard is implemented, freelancers gain significantly better control over their consulting business.
Instead of reacting to operational surprises, they can anticipate changes in demand, workload, and financial performance.
This produces several advantages.
Improved operational awareness
Freelancers understand the state of their business at any moment.
Stronger decision-making
Key indicators support strategic decisions.
Earlier risk detection
Potential problems become visible sooner.
Better system coordination
Pipeline, capacity, delivery, and financial metrics remain aligned.
The operations dashboard becomes the control center of the freelance consulting system.
Final Perspective
Freelancers often manage their business through scattered tools and fragmented information.
However, effective consulting operations require integrated visibility across multiple systems.
Within the Processome operating model, the → Delivery & Operations System ensures that freelancers maintain operational awareness through structured monitoring.
An operations dashboard transforms isolated data into a coherent view of the consulting business.
Visibility supports control.
Control supports stability.