Consultant Profit Dashboard (Track Revenue, Costs and Profit in One View)
Introduction
A consultant profit dashboard helps freelancers track revenue, costs, and profitability in one structured overview.
Freelancers often track revenue through invoices and payment records. While this provides visibility into income, it rarely reveals how effectively that revenue translates into profit.
Financial performance depends on more than total revenue. Profitability is influenced by delivery effort, cost structure, pricing strategy, and client portfolio composition.
Without structured visibility, freelancers struggle to answer:
- Which clients generate the strongest margins?
- How much profit is produced each month?
- How stable is the financial structure of the business?
Within the Processome operating model, financial monitoring belongs to the → Profit Tracking System—the framework responsible for translating operational activity into measurable financial outcomes.
A consultant profit dashboard consolidates key metrics into a single overview, allowing freelancers to monitor profitability and detect trends early.
Revenue shows activity.
Dashboards reveal performance.
What is a Consultant Profit Dashboard?
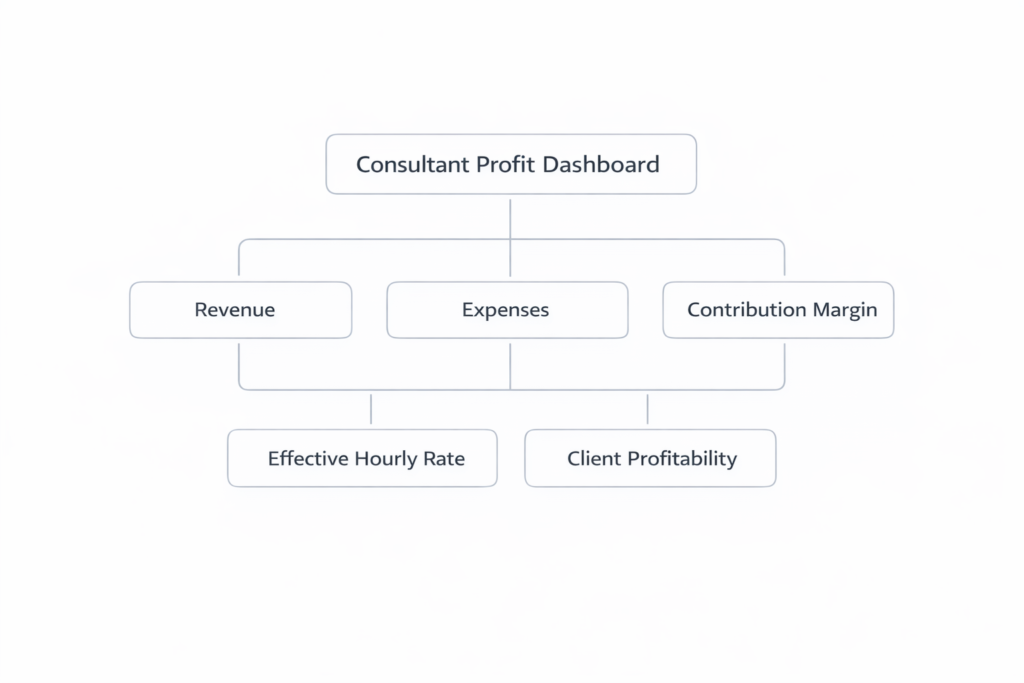
A consultant profit dashboard is a structured overview of the financial metrics that determine the economic health of a freelance consulting business.
Instead of analyzing isolated numbers, the dashboard combines multiple indicators into a single financial view.
Typical metrics include:
- total revenue
- contribution margin
- effective hourly rate
- revenue per client
- cost structure
- forecasted profit
These metrics are derived from core frameworks:
→ Contribution Margin in Freelance Businesses
→ Effective Hourly Rate Calculation Framework
→ Client Profitability Analysis for Freelancers
A dashboard does not create new data.
It organizes existing metrics so patterns become visible.
The Core Problem
Many freelancers track financial data across disconnected systems.
Examples include:
- invoices in accounting tools
- time tracking in separate apps
- expenses tracked independently
- profitability calculated manually
This fragmentation creates several issues.
Limited Profit Visibility
Revenue is visible—but profitability is unclear.
Delayed Insight
Problems appear only after they impact results.
Inconsistent Decisions
Pricing and client decisions rely on intuition.
Weak Forecasting
Financial planning becomes unreliable.
A dashboard consolidates these signals into one system.
Consultant Profit Dashboard Framework
A structured dashboard includes four categories of metrics.
1. Revenue Metrics
Track the scale of business activity.
Examples:
- monthly revenue
- revenue by client
- revenue by engagement
Revenue shows volume—but not efficiency.
2. Margin Metrics
Measure how efficiently revenue converts into profit.
Examples:
- contribution margin
- effective hourly rate
- project profitability
These metrics determine financial performance.
3. Cost Metrics
Track operational expenses.
Examples:
- fixed costs
- variable project costs
- subcontractor expenses
→ Break-Even Analysis for Freelancers
Cost visibility defines financial sustainability.
4. Client Portfolio Metrics
Evaluate how revenue is distributed.
Examples:
- revenue per client
- client profitability
- revenue concentration
→ Revenue Concentration Risk Explained
These reveal structural risks in the business.
Operational Impact
A profit dashboard improves several decisions.
Financial Visibility
Clear insight into how revenue converts into profit.
Pricing Evaluation
Pricing can be assessed based on real margins.
Client Portfolio Management
Identify high-value vs low-value clients.
Financial Forecasting
Improve accuracy of projections.
Dashboards turn financial data into actionable insight.
Tools That Support Profit Dashboards
To maintain a structured profit dashboard, tools that support:
- accounting
- time tracking
- financial reporting
can help consolidate your data.
→ Explore Profit Tracking Tools for Freelancers
These tools help organize financial information—but require a structured framework to be effective.
System-Level Impact Across Processome
A profit dashboard connects multiple systems.
- Client Pipeline System → revenue distribution insights
- Capacity Planning System → linking time to financial outcomes
- Profit Tracking System → monitoring profitability metrics
- Delivery & Operations System → identifying inefficiencies
Dashboards connect operational activity with financial performance.
Common Failure Patterns
Too Many Metrics
Excessive data obscures key insights.
Revenue-Focused Dashboards
Ignoring profitability leads to incomplete analysis.
Infrequent Updates
Outdated data reduces accuracy.
No Decision Integration
Metrics are tracked—but not used.
Effective dashboards focus on a small set of meaningful indicators.
Strategic Outcome
When freelancers maintain a structured profit dashboard, financial performance becomes easier to manage.
Instead of periodic reviews, consultants gain continuous visibility.
This produces:
- early detection of financial issues
- improved pricing and client decisions
- stronger financial discipline
Over time, dashboards transform data into operational intelligence.
Final Perspective
Freelancers often track revenue—but struggle to understand profitability.
A consultant profit dashboard converts scattered financial data into a structured overview of performance.
Within the Processome operating model, the → Profit Tracking System defines which financial metrics matter.
Dashboards do not replace financial thinking.
They make financial patterns visible.